The Ledger Letter
Finance Studio Advisors · Sunday, October 18, 2026
 

Stocks Rose After All 19 Midterms Since 1950. 2026 Already Spent Some of the Rally.

Americans vote in 16 days. History says that should be good news for stocks: the S&P 500 has been higher 12 months after every midterm election since 1950, by about 15% on average. This year does not fit the script, though. Midterm years are usually the weakest of the four-year cycle. In 2026 the index set a record on October 6 and is up 11.9% for the year.
 
The Breakdown
Today’s disagreement: the calendar says the best stretch for stocks starts now; valuations say much of it may already be in the price.
 
01
The Pattern
Deutsche Bank’s Jim Reid found the S&P 500 rose in 21 of the last 23 midterm cycles, measured from one month before the vote to two months after. The median gain was 7%.
02
The Exception
Midterm years themselves are usually rough. Since 1950, the midterm year has averaged a 4.6% gain, the weakest of the four years. The following calendar year has averaged about 17%.
03
The Twist
2026 broke that pattern early. The S&P 500’s deepest drop this year was 9.1%, about half the usual midterm-year decline, and the index sits near records.
A Message From Our Partner
President Trump just sat across from Xi Jinping, and I believe the fate of the U.S. dollar was in the room with them.
As China’s Premier arrived for the summit, the press obsessed over tariffs, Iranian sanctions, fentanyl, the military ceremony and the lavish state dinner.
Those were the things everyone was supposed to see.
But the most consequential part of this summit, something that could impact the financial life of every American, was never even mentioned.
I don’t believe Trump brought Xi Jinping to Washington merely to extend a trade truce or discuss sanctions.
I believe he was there to strengthen America’s grip on the most critical resource of the 21st century.
America desperately needs this important resource to reverse the decline of the U.S. dollar.
It’s a resource so powerful that Vladimir Putin has said whoever controls it will “become the ruler of the world.”
No one seems to be asking why Trump really filled the White House with the leaders of the world’s most powerful technology and financial companies…
Elon Musk. Jeff Bezos. Nvidia’s Jensen Huang. Google’s Sundar Pichai. Apple’s Tim Cook. OpenAi’s Sam Altman. BlackRock’s Larry Fink and Citigroup CEO Jane Fraser.
Or what these men and women, who between them control more capital than most nations, were really there to discuss.
And almost nobody seems to have connected what happened inside that room to a landmark pact signed by 13 nations inside the State Department… a pact designed to cut China out of the biggest investment wave in financial history.
And I believe what I’ve uncovered could profoundly affect everything about your financial future, from your stock portfolio to the purchasing power of every dollar you’ve saved.
In my new documentary, I expose exactly what I believe Trump is really doing, how he has completely bypassed Congress to make it happen, and I share the five mission-critical assets sitting at the heart of a shocking, multi-trillion-dollar gambit to reset the U.S. Dollar.
GO HERE FOR THE FULL STORY.
Trump's New Dollar
Good investing,
Porter Stansberry
 
By the Numbers
Days Until the Vote16 (Tuesday, Nov. 3)
S&P 500 After Midterms Since 1950Higher in 19 of 19 years
Average 12-Month Gain AfterAbout 15%
S&P 500, 2026 Year to DateUp 11.9% through Oct. 16
Market Value to GDPAbout 235%, near a record
Midterm data per Opening Bell Daily, Deutsche Bank via Yahoo Finance and Silvia Insights via Finbold. Valuation per The Motley Fool via Yahoo Finance. October 2026.

A Reliable Pattern Meets an Unusual Year

What the Headlines Lead With

Most coverage this weekend leads with the clean historical record. Nineteen midterms since 1950, nineteen positive years afterward. Few calendar patterns on Wall Street are that consistent.

Fidelity’s longer study, going back to 1938, finds gains 95% of the time in the 12 months after a midterm.

Reid argues this year has an extra tailwind. S&P 500 earnings for the third quarter are expected to grow about 30% from a year ago.

A Message From Our Partner
Midterm Boom
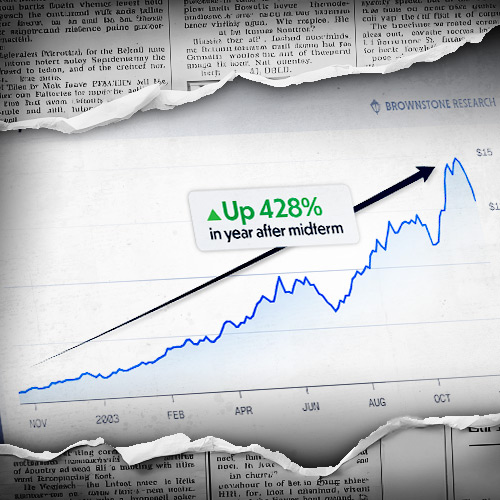
In 2002, the market was left for dead.
Then Avaya soared 428%… Corning 215%… Yahoo 175%.
The trigger?
A phenomenon that has fired every time for 78 years.
It happens again November 3.
GET THE FULL STORY.
Why the Pattern Usually Works

The usual explanation is uncertainty. Before the vote, investors cannot price which party controls Congress, so they hold back. After the vote, the range of outcomes narrows and money returns.

That explains why midterm years tend to be choppy and the months after tend to be strong. The rally usually rewards investors who sat through the volatility.

This year, the volatility mostly skipped. Stocks climbed through the summer despite higher oil prices, tariffs and talk of more rate hikes.

Our view: a pattern built on relief works best when there is something to be relieved from. With the index near records, there is less pent-up caution to release.

What Could Break the Streak

Two past cases are worth knowing. In 1978, stocks fell around the midterms as inflation and interest rates climbed. In 2018, the S&P 500 dropped more than 10% during the midterm cycle.

Both risks are present now. September’s core inflation came in hotter than expected, and markets have priced a real chance of another Fed hike before year end.

Valuations add a third risk. The total value of US stocks sits near 235% of GDP, close to the record set in August. That leaves less room for disappointment.

None of these guarantees a decline. Together, they explain why some strategists expect a smaller post-election rally than the historical average.

From Our Partner
One small company gets paid on all of it, and Elon’s been paying them since 2012.
The Week Ahead

Earnings season moves into its busiest stretch, and those results matter more than the calendar. A 30% growth forecast leaves little room for misses.

Watch the S&P 500 relative to its October 6 record of 7,818.93. A move back to that level before the vote would suggest investors are already buying the post-midterm pattern early.

Worth watching: Treasury yields. If they keep rising into November, the 1978 playbook becomes more relevant than the 19-for-19 record.

History favors the months after a midterm. It just rarely starts from a record high.

Recommended for you

View all
caret-right